
3- Platforms
Remote sensing platforms are defined as vehicles, such as aircraft or satellites, that can carry sensing devices to perform remote measurement operations. These platforms are continuously improving in terms of operational time, reliability, simplicity, temporal resolution (the time interval between successive remote sensing measurements), and flexibility in altitude adjustment, which indirectly affects the spatial resolution (the ground dimension corresponding to a pixel in an image). With the current technological advances, a diverse range of platforms with specific characteristics are available. As a result, choosing a suitable platform depends on the nature of the problem. Each platform has strengths and weaknesses that involve technological, operational, and economic factors. Satellite imagery can quickly map a vast area, but their spatial resolution is coarse for some PA proposes. Unmanned aerial systems (UAS), on the other hand, are well suited for small-scale and research applications, and they can provide very high spatial resolutions. However, the limited payload and short flight endurance remain the main drawbacks for large-scale UAS implementation. Manned aircraft fall in between, covering larger areas compared to UAS and delivering higher spatial resolution than satellites.
Three critical factors for selecting the best platform are spatial resolution, farm size, and operation cost. While a direct comparison among different platforms is challenging, a cost analysis (in 2014) showed that the adoption of UAS platforms for aerial imagery is profitable in areas less than five hectares; above such threshold, manned aircraft and then satellites have lower operation costs [1]. This threshold extended to 20 ha in 2018 [2].
Figure 1 shows a coarse classification of different platforms based on altitude and flight endurance. In this classification, aircraft (manned or unmanned) can be divided into four categories of Low-Altitude Short Endurance (LASE), Low-Altitude Long Endurance (LALE), Medium-Altitude Long Endurance (MALE), and High-Altitude Long Endurance (HALE) [3]. Even though HALE and MALE categories have some advantages in flight time and energy efficiency, they are expensive, complicated, and their operation-altitude conflicts with that of passenger aircraft; therefore, LALE and LASE platforms are more common for agricultural remote sensing applications [4]. Most of the commonly used UAS used in agricultural remote sensing fit in the LASE class with a limited flight altitude of lower than 1500 m above ground level (AGL). However, new legislation in some countries further limits UAS flight ceiling. This limit varies from country to country and ranges from 90 to 150 m AGL[4] and sometimes permission might be required for conducting a flight. As a result, small Unmanned Aerial Systems (sUAS) that meet the legislated law requirements while being low-cost and user-friendly became prevalent.
Satellites, on the other hand, work at altitudes higher than airspace of any aircraft. Remote sensing satellites, in particular, are in a specific range of Low Earth orbit (LEO), much closer to the surface of the earth than other satellites such as Global Navigation Satellite System (GNSS), which are in Medium Earth orbit (MEO). Landsat 8 and QuickBird, for instance, orbit at an altitude of about 705 km, and 450 km, respectively.
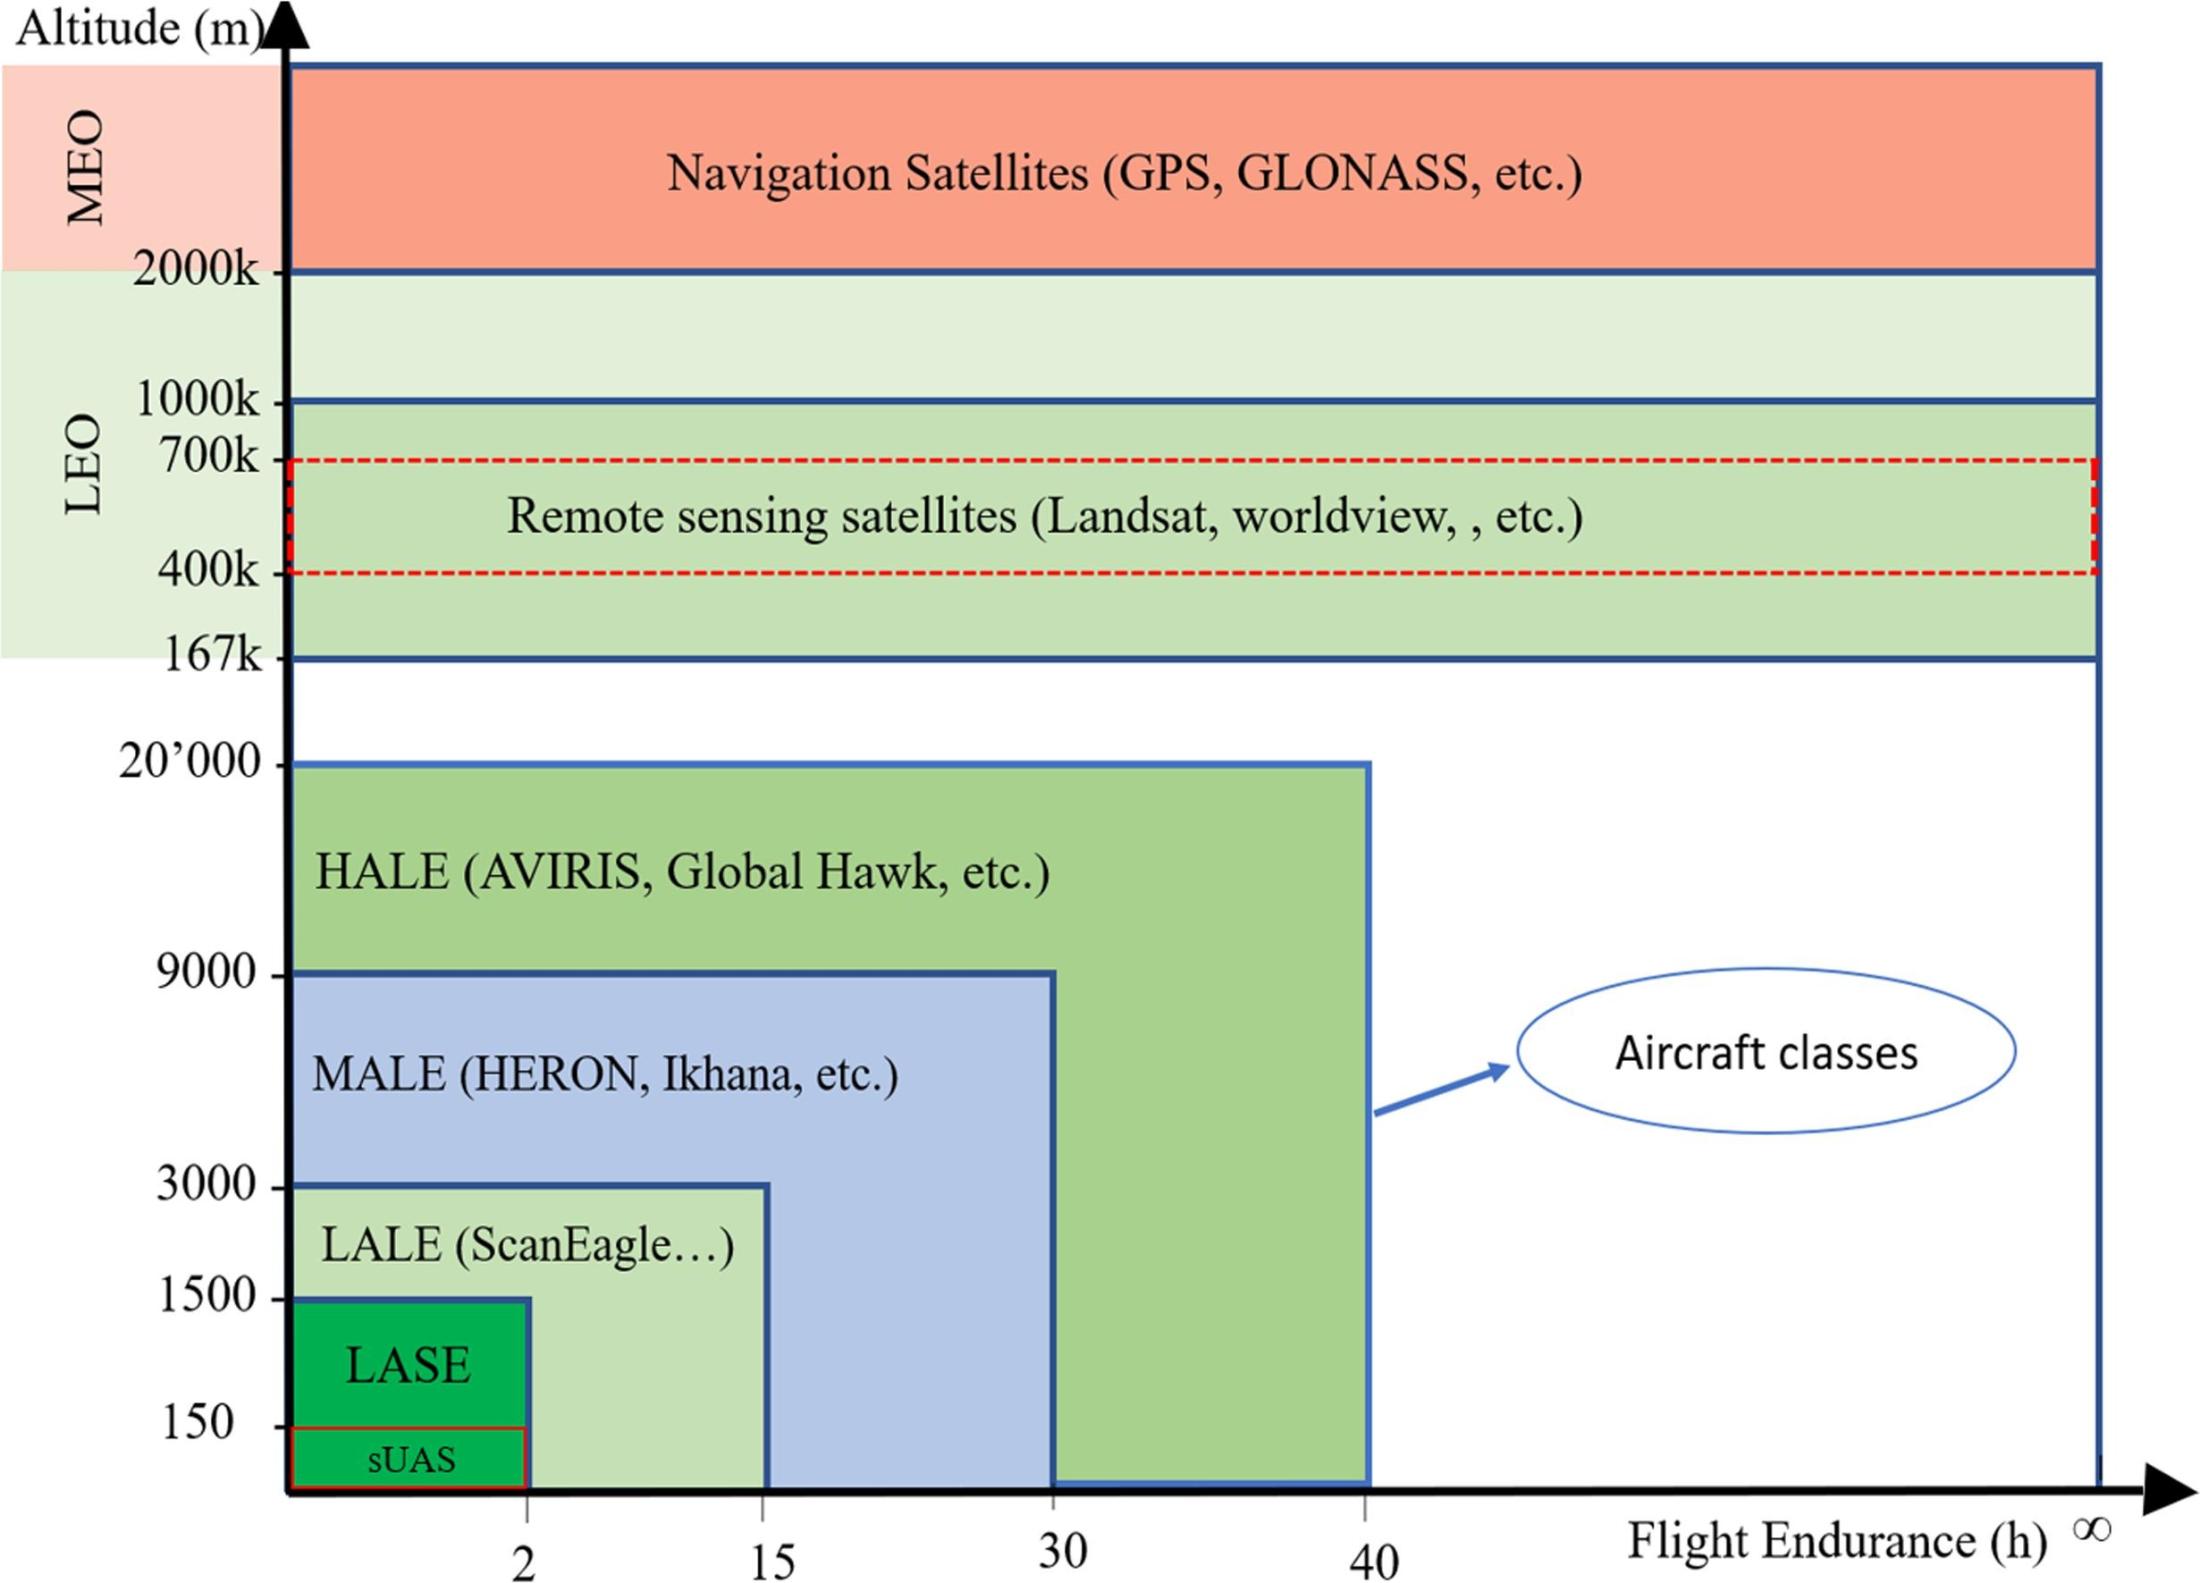
Figure 1- Remote sensing platforms based on their altitude and flight time. HALE (High-Altitude Long Endurance), MALE (Medium-Altitude Long Endurance), LALE (Low-Altitude Long Endurance), and LASE (Low-Altitude Short Endurance) are the main classification of aircraft platforms where sUAS are a sub-class of LASE with a maximum take-off weight of 25 kg (55lb). Satellites on the other hand, make measurements from as far as 400k meters away[3] [4].
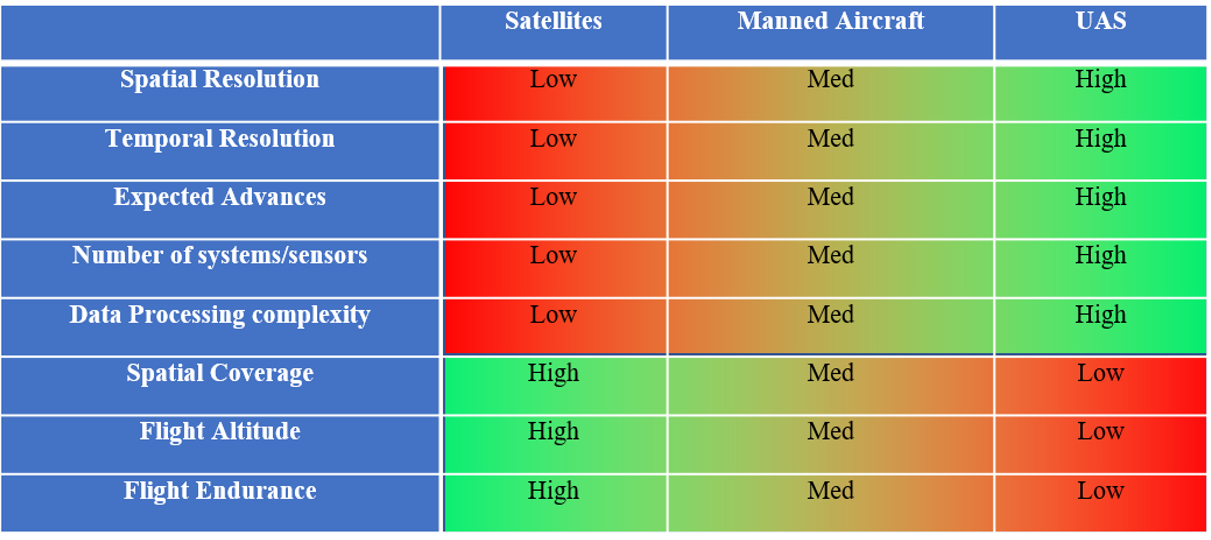
In this section, three main remote sensing platforms; UAS, manned aircrafts, and satellites are reviewed in detail. Table 1 compares satellites, manned aircraft, and UAS in terms of their essential characteristics. In-depth comparisons can be found at [2]. One of the most noticeable features in this table is high expected advances in upcoming years for UAS compared to manned aircraft and satellites. It is also shown that spatial and temporal resolutions, the number of practical devices currently being used, and data processing complexity are all higher for UAS compared to the other platforms. On the other hand, spatial coverage and flight endurance are the main advantages of satellites over UAS and manned aircraft.
Table 1-comparison of satellites, manned aircraft, and UAS for their strength and weakness
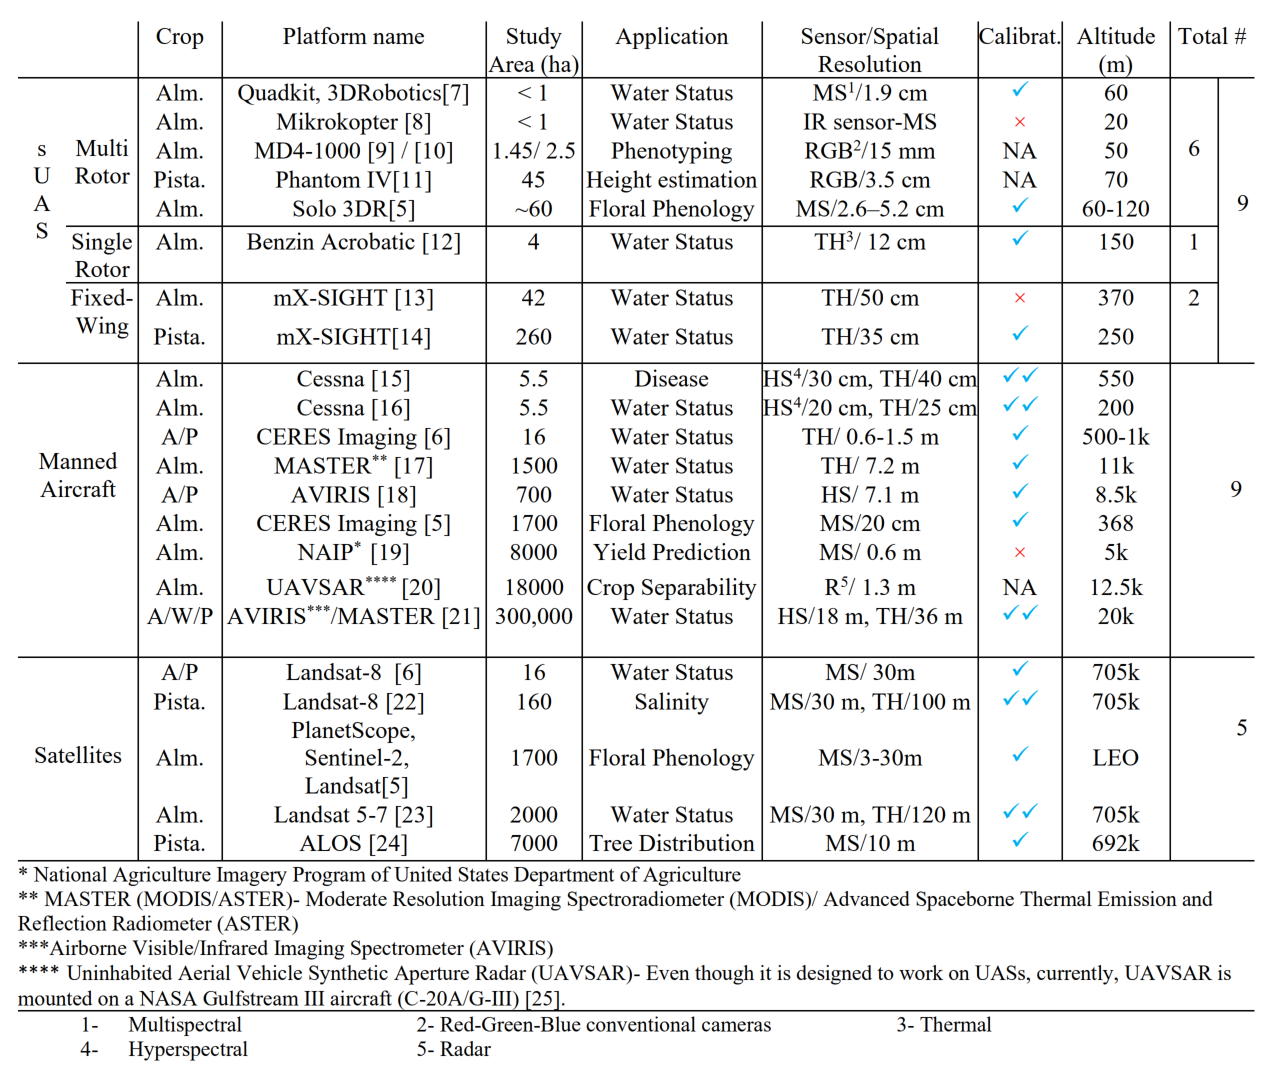
For further comparison of the platforms, sensors, analysis methods, etc. 20 papers on remote sensing of almond, walnut, and pistachio orchards were selected, and results were compared. Table 2 includes the platforms used in these studies. Some studies used more than one platform. For example, in [5] sUAS, manned aircraft, and satellite platforms are used simultaneously, and in [6] manned aircraft and satellite data combined to extract as much data as possible. Besides the platforms, the type of the sensors - RGB, multispectral (MS), hyperspectral (HS), and Thermal (TH)- study aera, intended application, whether or not the sensors were calibrated, and flight altitude are also specified in this table. Platforms, sensors and their calibration, and applications will be discussed in detail in the following sections.
Table 2- Platform types, application and sensors used in Almond, Walnut, and Pistachio studies[2].
- References
[1] A. Matese et al., “Intercomparison of UAV, aircraft and satellite remote sensing platforms for precision viticulture,” Remote Sensing, vol. 7, no. 3, pp. 2971–2990, 2015, doi: 10.3390/rs70302971.
[2] S. Manfreda et al., “On the use of unmanned aerial systems for environmental monitoring,” Remote sensing, vol. 10, no. 4, p. 641, 2018.
[3] A. C. Watts, V. G. Ambrosia, and E. A. Hinkley, “Unmanned aircraft systems in remote sensing and scientific research: Classification and considerations of use,” Remote Sensing, vol. 4, no. 6, pp. 1671–1692, 2012.
[4] C. Stöcker, R. Bennett, F. Nex, M. Gerke, and J. Zevenbergen, “Review of the current state of UAV regulations,” Remote sensing, vol. 9, no. 5, p. 459, 2017.
[5] B. Chen, Y. Jin, and P. Brown, “An enhanced bloom index for quantifying floral phenology using multi-scale remote sensing observations,” ISPRS Journal of Photogrammetry and Remote Sensing, vol. 156, pp. 108–120, 2019.
[6] J. Bellvert, K. Adeline, S. Baram, L. Pierce, B. L. Sanden, and D. R. Smart, “monitoring crop evapotranspiration and crop coefficients over an almond and pistachio orchard throughout remote sensing,” Remote Sensing, vol. 10, no. 12, Dec. 2018, doi: 10.3390/rs10122001.
[7] T. Zhao, B. Stark, Y. Q. Chen, A. L. Ray, and D. Doll, “Challenges in Water Stress Quantification Using Small Unmanned Aerial System (sUAS): Lessons from a Growing Season of Almond,” Journal of Intelligent and Robotic Systems: Theory and Applications, vol. 88, no. 2–4, pp. 721–735, Dec. 2017, doi: 10.1007/s10846-017-0513-x.
[8] K. E. Crawford, “Remote Sensing of Almond and Walnut Tree Canopy Temperatures Using an Inexpensive Infrared Sensor on a Small Unmanned Aerial Vehicle,” University of California, Davis, California, Davis, 2014.
[9] F. López-Granados, J. Torres-Sánchez, F. M. Jiménez-Brenes, O. Arquero, M. Lovera, and A. I. de Castro, “An efficient RGB-UAV-based platform for field almond tree phenotyping: 3-D architecture and flowering traits,” Plant Methods, vol. 15, no. 1, pp. 1–16, 2019.
[10] J. Torres-Sánchez et al., “Mapping the 3D structure of almond trees using UAV acquired photogrammetric point clouds and object-based image analysis,” Biosystems engineering, vol. 176, pp. 172–184, 2018.
[11] S. Y. Erfanifard, A. Chenari, M. Dehghani, and F. Amiraslani, “Effect of spatial resolution of UAV aerial images on height estimation of wild pistachio (Pistacia atlantica Desf.) trees.,” Iranian Journal of Forest and Poplar Research, vol. 27, no. 2, 2019.
[12] V. Gonzalez-Dugo, P. Zarco-Tejada, J. A. J. Berni, L. Suárez, D. Goldhamer, and E. Fereres, “Almond tree canopy temperature reveals intra-crown variability that is water stress-dependent,” Agricultural and Forest Meteorology, vol. 154–155, p. 156, 2012, doi: 10.1016/j.agrformet.2011.11.004.
[13] V. Gonzalez-Dugo et al., “Using high resolution UAV thermal imagery to assess the variability in the water status of five fruit tree species within a commercial orchard,” Precision Agriculture, vol. 14, no. 6, pp. 660–678, Dec. 2013, doi: 10.1007/s11119-013-9322-9.
[14] V. Gonzalez-Dugo, D. Goldhamer, P. J. Zarco-Tejada, and E. Fereres, “Improving the precision of irrigation in a pistachio farm using an unmanned airborne thermal system,” Irrigation science, vol. 33, no. 1, pp. 43–52, 2015.
[15] M. López-López, R. Calderón, V. González-Dugo, P. Zarco-Tejada, and E. Fereres, “Early Detection and Quantification of Almond Red Leaf Blotch Using High-Resolution Hyperspectral and Thermal Imagery,” Remote Sensing, vol. 8, no. 4, p. 276, Mar. 2016, doi: 10.3390/rs8040276.
[16] C. Camino, P. Zarco-Tejada, and V. Gonzalez-Dugo, “Effects of heterogeneity within tree crowns on airborne-quantified SIF and the CWSI as indicators of water stress in the context of precision agriculture,” Remote Sensing, vol. 10, no. 4, p. 604, 2018.
[17] S. Roy and D. Ophori, “Estimation of crop water stress index in almond orchards using thermal aerial imagery.,” Journal of Spatial Hydrology, vol. 12, no. 1, 2014.
[18] T. Cheng, D. Riaño, and S. L. Ustin, “Detecting diurnal and seasonal variation in canopy water content of nut tree orchards from airborne imaging spectroscopy data using continuous wavelet analysis,” Remote Sensing of Environment, vol. 143, pp. 39–53, Mar. 2014, doi: 10.1016/j.rse.2013.11.018.
[19] Z. Zhang, Y. Jin, B. Chen, and P. Brown, “California almond yield prediction at the orchard level with a machine learning approach,” Frontiers in plant science, vol. 10, p. 809, 2019.
[20] H. Li, C. Zhang, S. Zhang, and P. M. Atkinson, “Full year crop monitoring and separability assessment with fully-polarimetric L-band UAVSAR: A case study in the Sacramento Valley, California,” International Journal of Applied Earth Observation and Geoinformation, vol. 74, pp. 45–56, Feb. 2019, doi: 10.1016/j.jag.2018.08.024.
[21] S. W. Shivers, D. A. Roberts, and J. P. McFadden, “Using paired thermal and hyperspectral aerial imagery to quantify land surface temperature variability and assess crop stress within California orchards,” Remote Sensing of Environment, vol. 222, pp. 215–231, Mar. 2019, doi: 10.1016/j.rse.2018.12.030.
[22] Y. Jin et al., “Spatially variable evapotranspiration over salt affected pistachio orchards analyzed with satellite remote sensing estimates,” Agricultural and Forest Meteorology, vol. 262, pp. 178–191, Nov. 2018, doi: 10.1016/j.agrformet.2018.07.004.
[23] R. He et al., “Evapotranspiration estimate over an almond orchard using landsat satellite observations,” Remote Sensing, vol. 9, no. 5, p. 436, 2017.
[24] H. Fadaei, T. Sakai, and K. Torii, “Investigation on pistachio distribution in the mountain regions of northeast Iran by ALOS,” Front. Agric. China, vol. 5, no. 3, p. 393, Sep. 2011, doi: 10.1007/s11703-011-1108-0.
[25] H. Kramer, “UAVSAR - eoPortal Directory - Airborne Sensors,” 2013. https://earth.esa.int/web/eoportal/airborne-sensors/uavsar (accessed Feb. 19, 2021).