
Sensors
Almost all sensors used for remote sensing applications in agriculture involve some regions of the electromagnetic spectrum. Early in the 1960s, a researcher named Evelyn Pruitt coined the term “remote sensing” when she recognized that aerial photography or aerial imagery no longer accurately described the many forms of imagery collected using radiation outside the visible region [1]. In the current literature, remote sensing is the science of acquiring and interpreting information about objects without being in physical contact. It includes sensing and recording reflected or emitted energy (in any wavelength), processing, and analyzing data to convert them to knowledge[2]. All objects emit energy in the form of electromagnetic radiation when their absolute temperature is above absolute zero, called black body radiation. With an absolute temperature of 5778 k, the sun is the primary source of energy and electromagnetic radiation on earth. As shown in figure 3, the sun's radiation is mainly in the form of visible light and infrared radiation with a peak wavelength around 500 nm. Moreover, the earth itself, with a 290 K temperature, has a weak radiation in a wide range with a peak at around 10 µm. As a result, passive sensors, sensors that measure naturally occurring radiations, depend on either the sun’s or earth’s radiations and are designed to work in spectrum regions with the highest radiation energy. For example, thermal detectors are usually designed to be sensitive to the radiation with wavelength from 7 µm to 14 µm [3].
Each region in the electromagnetic spectrum carries useful information for a specific purpose. For example, 0.4 to 0.7 µm, which is the visible range, is used for vision-based sensing such as chlorophyll studies, green indices, morphological analysis of leaves and fruits, and vision-based measures to quantify all valuable data that are perceptible by a naked eye. On the other hand, the infrared region is used for extracting data that are otherwise hidden from our eyes, such as water content and stress-related studies. Figure 3 shows the electromagnetic spectrum with separated regions and example applications in agriculture for each region. There are no clear-cut boundaries dividing the electromagnetic regions; boundaries vary based on the application. The irradiance graph covering 250-2500 nm of the spectrum, the most commonly used region for agricultural remote sensing[4], depicts the sun's black body radiation, radiations available in outer space, and sea-level radiations [5]. As discussed in satellite remote sensing problems, atmospheric attenuation affects most of the spectrum with varying degrees and filters some bands entirely. The resistance of electromagnetic radiation against attenuation by the atmosphere and specific particles depends on its wavelength and its interaction with the particles. For example, water vapor strongly absorbs radiation at around 1.1 µm and 1.34 µm while in between almost no energy is absorbed by water. A detailed list of atmospheric gases and their absorption bands can be found at [6]. The visible region of the sun’s radiation undergoes minimal atmospheric attenuation making it a powerful region for remote sensing purposes. In this region, a large number of relatively high-energy photons (higher the frequency, higher the energy) create the highest watts per square meter per nanometer (Irradiance – see Figure 3), large enough to trigger a tiny detector (higher spatial resolution). The farther from the visible range, the smaller the irradiance in both directions. As a result, bigger (lower spatial resolution) or more sensitive detectors are required to measure the changes. When the amount of natural irradiance is too small, measuring the differences becomes challenging, inspiring the idea of using active sensors.
Active sensors include an energy source that emits electromagnetic energy in specific wavelengths and measure the reflectance as opposed to passive sensors, which measure naturally occurring emission or reflection from objects. Radar, Microwave remote sensing, and Light Detection and Ranging (LiDAR), are examples of active sensors used in remote sensing. When a radiated signal reaches an object's surface, three major forms of interaction take place: absorption, transmission, and reflection. In most of the remote sensing sensors, the reflected portion of the radiation is measured [7]. The ratio of reflected radiation to incident radiation, which is defined as reflectance, plays a key role in revealing the surface’s features.
As can be seen in Figure 3, specific wavelengths are suitable for each application. An effective wavelength can be selected based on the structure and components of materials being sensed, the distance between the sensor and the object, and cloud, dust, or other particles between the object and the sensor. For instance, while clouds and water vapor block visible bands, radar signals can easily penetrate through them. Most of the sensors used for agricultural remote sensing are taking advantage of specific wavelengths. A comprehensive comparison of available sensors for UAS applications, including optical, multi/hyperspectral, thermal cameras, and LiDARs, are presented at [8].
Beside sensitive wavelengths, other essential parameters of any remote sensing sensors are: spectral, radiometric, and spatial resolutions. The electromagnetic spectrum contains continuous wavelengths, while the digital sensors take discrete measurements. Sensors are usually characterized by their sensitive range and spectral resolution. Spectral resolution defines the number of measurements that a sensor can conduct at different wavelengths within a specific spectral range, i.e., the number of bands (or channels) in the instrument's sensitive range[9]. For example, the spectral resolution of a hyperspectral sensor that is sensitive to 400-1000 nm region and can measure 100 bands would be 6 nm. As a result, there would be one measurement at every 6 nm. However, higher spectral resolution means the reflected energy from a surface needs to be divided into more parts, and as a result, each part receives a small portion of the energy that negatively affects the spatial resolution. However, the precision of each recording depends on the radiometric resolution. Radiometric resolution is another important characteristic of spectral sensors defined as the sensor's ability to perceive and distinguish minimum change within its dynamic range, i.e., the precision at which the sensor records the data. Radiometric resolution often depends on the bit-depth of the sensor. For instance, an 8-bit and a 12-bit sensor would have 8 and 12 radiometric resolutions, i.e., 256 and 4,096 levels of intensity for each measured parameter, respectively.
Spatial resolution that is mentioned earlier is probably the most important feature of sensors that depends on the size of the detector arrays inside the sensor. Spatial resolution is defined as a measure of the smallest object that the sensor can resolve or the linear dimension on the ground represented by each pixel [10] referred to as Ground Sampling Distance (GSD). Besides the detector array, Field of View (FOV) and object's distance from the sensor are also important for determining the spatial resolution. For instance, a thermal camera that uses a 500*500 array of detectors and has a 90-degree FOV installed on a drone flying at an altitude of 100 meters would have a 40 cm resolution. In other words, an object of size 40 cm×40 cm will fit in one pixel of the sensor. However, spectral resolution and spatial resolution are inversely related hence, a tradeoff is involved in having higher resolutions.
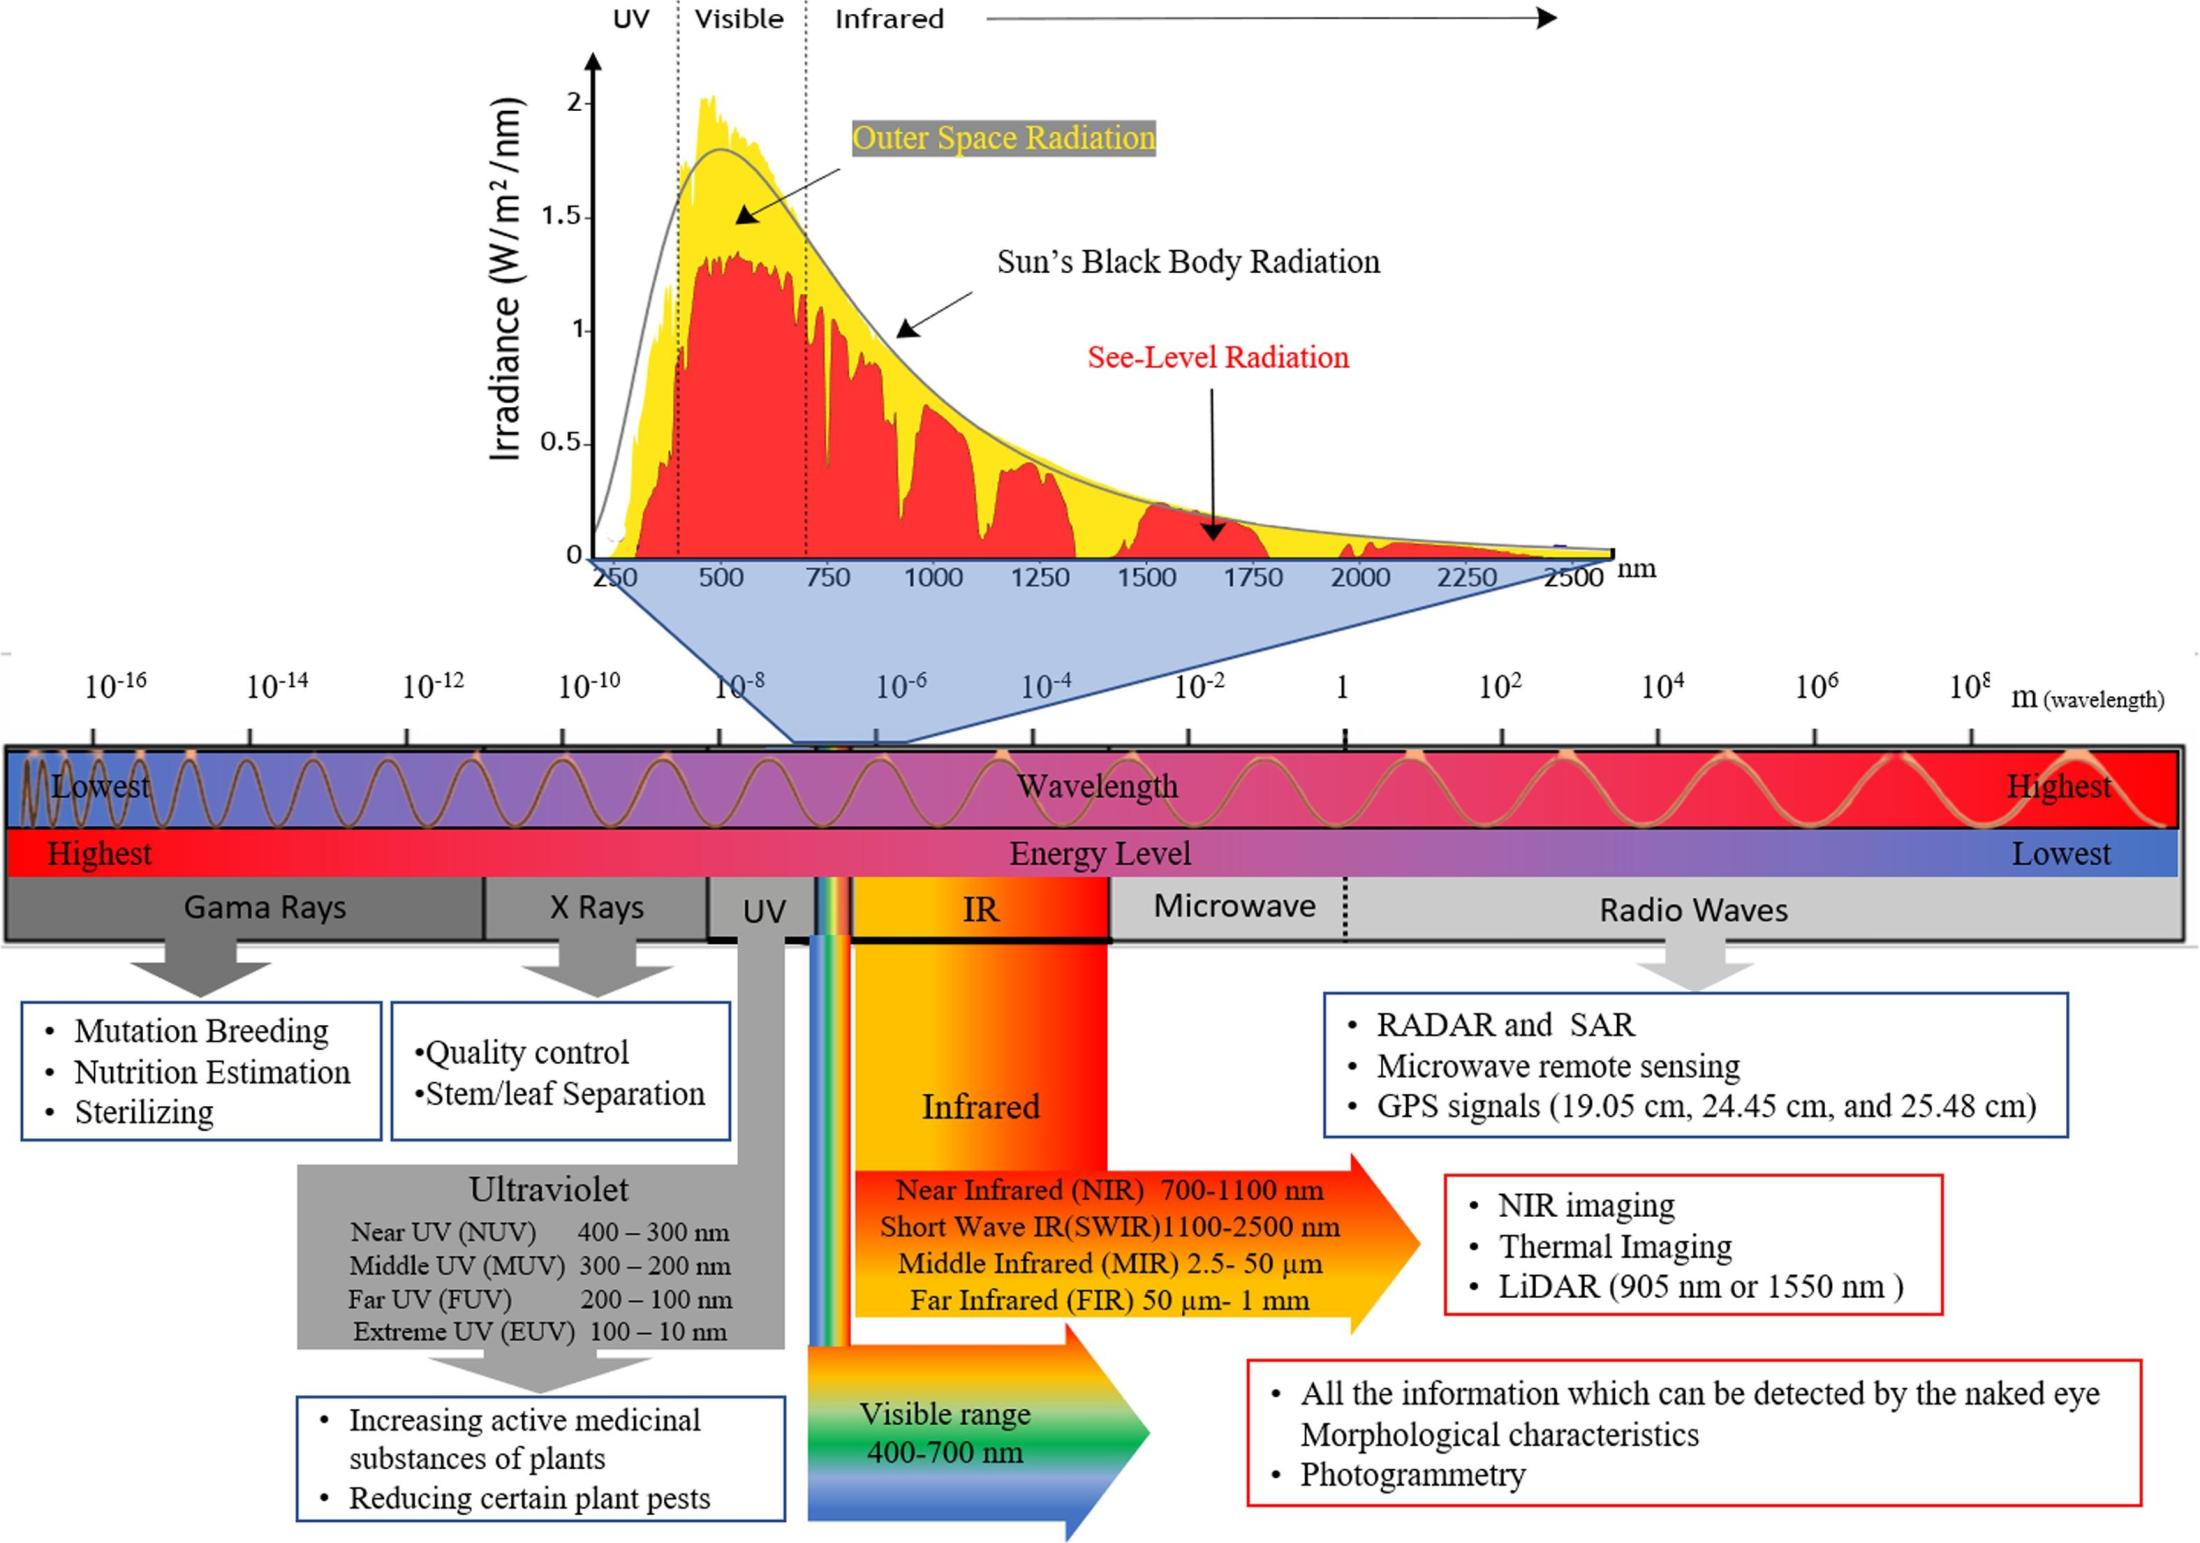
Figure 3 - The Electromagnetic spectrum, different wavelengths and regions, bands’ energy level, and some examples of their use in agricultural remote sensing applications. 300-2500 nm, the most commonly used region in agricultural remote sensing, is highlighted with solar radiation graphs outside and inside the earth’s atmosphere (solar radiation graph modified from [5]).
References
[1] J. B. Campbell and R. H. Wynne, Introduction to remote sensing. Guilford Press, 2011.
[2] A. J. Hawley, Remote Sensing: With Special Reference to Agriculture and Forestry. JSTOR, 1971.
[3] W. G. Rees, Physical principles of remote sensing. Cambridge University Press, 2013.
[4] S. von Bueren, A. Burkart, A. Hueni, U. Rascher, M. Tuohy, and I. Yule, “Comparative validation of UAV based sensors for the use in vegetation monitoring,” Biogeosciences Discussions, vol. 11, no. 3, pp. 3837–3864, 2014.
[5] V. Walter, M. Saska, and A. Franchi, “Fast mutual relative localization of uavs using ultraviolet led markers,” in 2018 International Conference on Unmanned Aircraft Systems (ICUAS), 2018, pp. 1217–1226.
[6] I. E. Gordon et al., “The HITRAN2016 molecular spectroscopic database,” Journal of Quantitative Spectroscopy and Radiative Transfer, vol. 203, pp. 3–69, 2017.
[7] T. Zhao, “REMOTE SENSING OF WATER STRESS IN ALMOND TREES USING UNMANNED AERIAL VEHICLES,” p. 131, 2018.
[8] S. Manfreda et al., “On the use of unmanned aerial systems for environmental monitoring,” Remote sensing, vol. 10, no. 4, p. 641, 2018.
[9] J. R. Jensen, Remote sensing of the environment: An earth resource perspective 2/e. Pearson Education India, 2009.
[10] S. Liang and J. Wang, Advanced remote sensing: terrestrial information extraction and applications. Academic Press, 2019.