
2020 HiRes Vineyard Nutrition Research Update
Selecting Optimal Multispectral Bands for Remote Sensing of Grapevine Nitrogen Using Hyperspectral Data
Selecting Optimal Multispectral Bands for Remote Sensing of Grapevine Nitrogen Using Hyperspectral Data
By Alireza Pourreza, and Ryan Omidi (Digital Agriculture Lab, UC Davis)
Reference: Omidi, R., Moghimi, A., Pourreza, A., El-Hadedy, M., & Eddin, A. S. (2020). Ensemble Hyperspectral Band Selection for Detecting Nitrogen Status in Grape Leaves. arXiv preprint arXiv:2010.04225.
California is the top producer of grapes in the United States [CDFA]. In fact, grapes were the number one valued crop in California in 2017 [CDFA]. Table grapes, the kind which is eaten fresh, had a total crop value of $1.76 billion in 2018 [CTGC]. Nitrogen is an essential macronutrient that affects the total crop yield in grapes. However, nitrate, one of California’s most widespread groundwater contaminants, is a by-product of nitrogen use in croplands [Center for Watershed Sciences]. Growers need to monitor the grapevines to prevent deficiencies or excesses of nitrogen that can damage the crop and apply synthetic fertilizers or manure accordingly. Considering that table grapes are an important local commodity grown in large volumes, there exists a motivation to better monitor nitrogen status and allocate fertilizers to improve farm profitability while reducing environmental harm from over-fertilization.
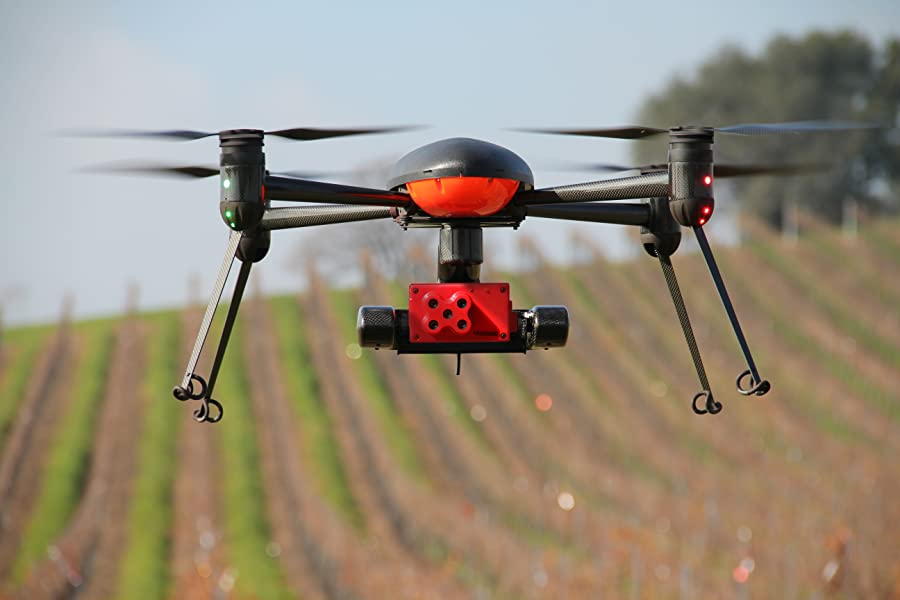
The industry standard for nitrogen monitoring is hand collecting leaf tissue samples from different plants, mixing them, then sending samples to a commercial lab for chemical analysis. This method is time-consuming due to the laborious sample collection process and the shipping and processing time involved for results from a commercial lab. The spatial resolution is low since many leaves are mixed together for each composite sample, so the lab result will essentially be an average of many leaves. The prices for lab analysis can typically run from $20 to $30 per sample, which can be pretty costly for extensive vineyards. Unmanned aerial vehicles (UAVs) equipped with multispectral cameras, in contrast, can be quickly flown over the vineyard by remote control, offering rapid sample collection, immediate results, high spatial resolution, and affordability long term.
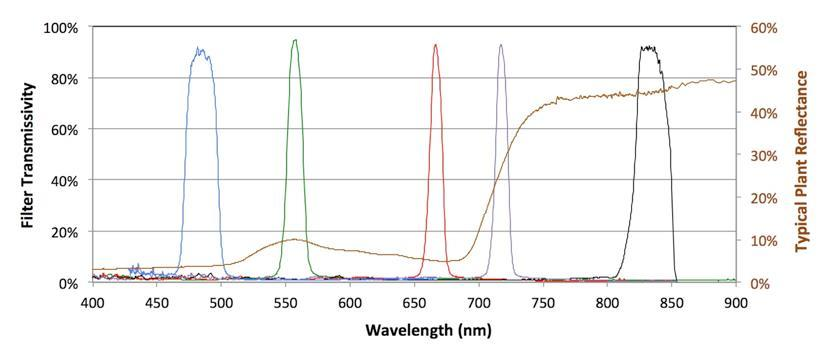
Multispectral and hyperspectral sensors are commonly utilized in agricultural remote sensing. Hyperspectral sensors measure hundreds of wavelengths at the acceptable spectral resolution but suffer from large data sizes and redundant measurements, making data processing suboptimal and computation costly. Multispectral sensors measure several wavelengths at the relatively lower spectral resolution, but typically only in the blue, green, red, red edge, and near-infrared bands, which may not be optimal for a given remote sensing task. We investigated the spectral characteristic of grape leaves with various level of nitrogen content to identify the most informative set of wavelengths that can be translated into a large-scale remote sensing methodology for monitoring nitrogen deficiency in vineyards. Designing an application-specific multispectral sensor would exploit the benefits of multispectral sensors while minimizing the drawbacks.
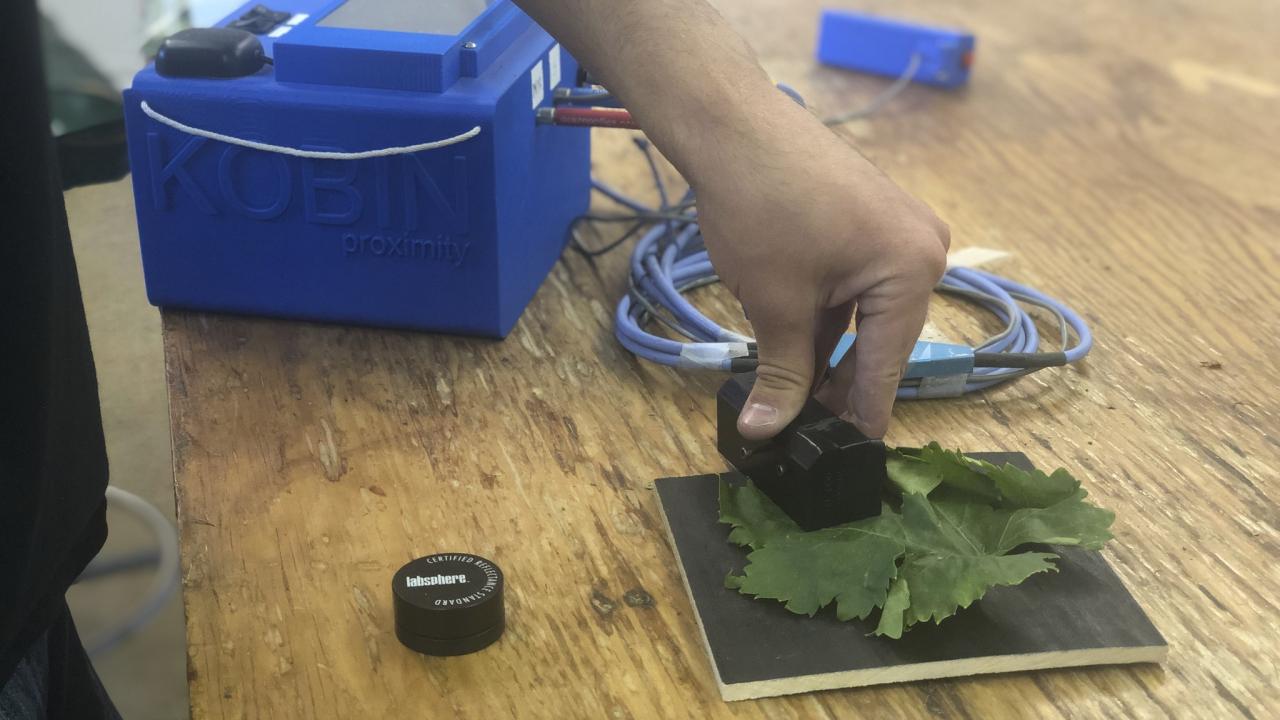
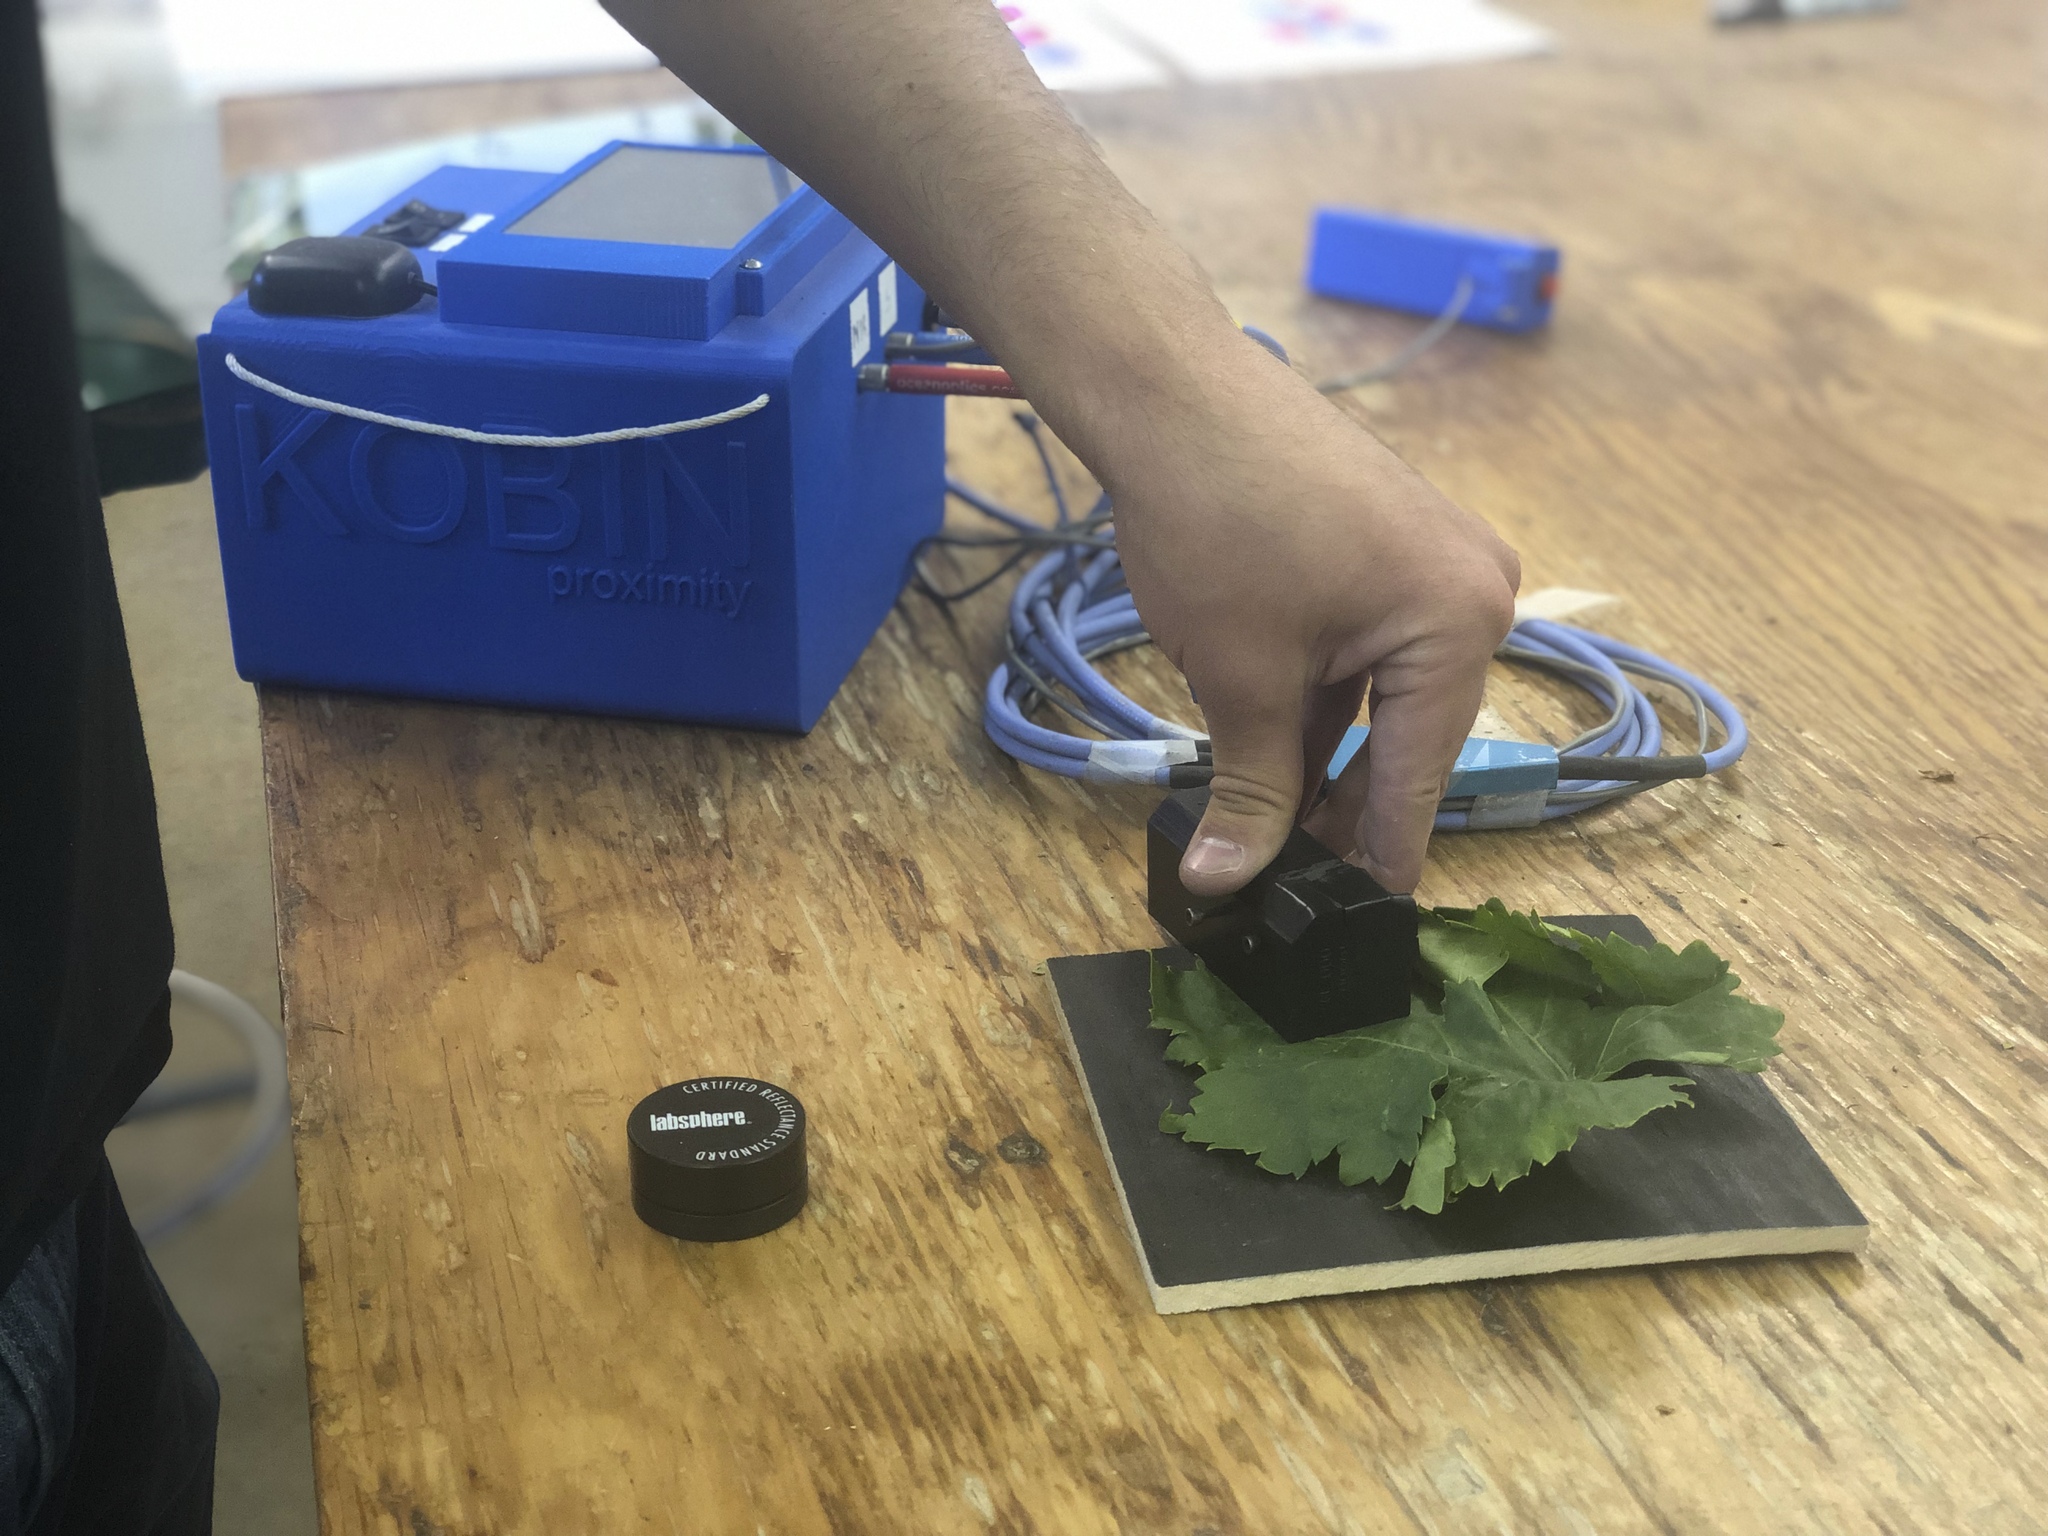
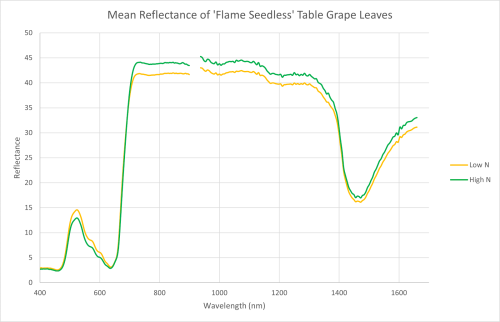
We collected Hyperspectral measurements from 150 ‘Flame Seedless’ grapevines in an experimental plot in Kingsburg, CA. Vines in the plot either remained non-fertilized or received different amounts of fertilization to induce a range of leaf nitrogen content. About 20 leaves were scanned per vine for a total of over 3000 samples. The roughly 20 leaves per vine were dried and mixed to obtain a single lab-measured nitrogen label per vine. Outliers and samples with moderate nitrogen levels were not used, leaving 948 samples for analysis.
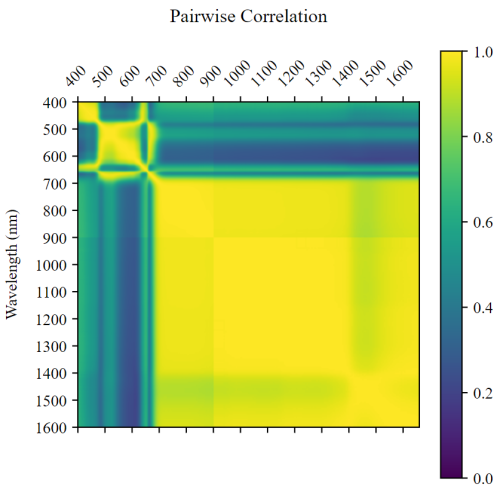
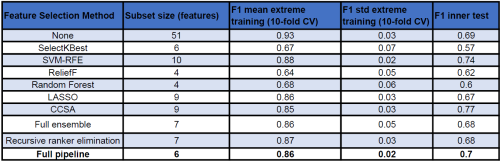
As expected, there were very high correlations between the many redundant bands from the hyperspectral sensor, especially between ~700 and ~900 nm and ~936 and ~1350 nm. A downscaling step that averaged adjacent bands with a correlation over 0.99 greatly reduced the feature set size from 1,339 wavelengths to just 51 bands. These bands were ranked on their informativeness about nitrogen content using six machine learning techniques: SelectKBest, SVM-RFE, ReliefF, Random Forest, LASSO, and Chaotic Crow Search Algorithm, which each offered differing rankings of the bands. These techniques were grouped into ensembles to aggregate their rankings and put through several iterations to identify the optimal set of bands.
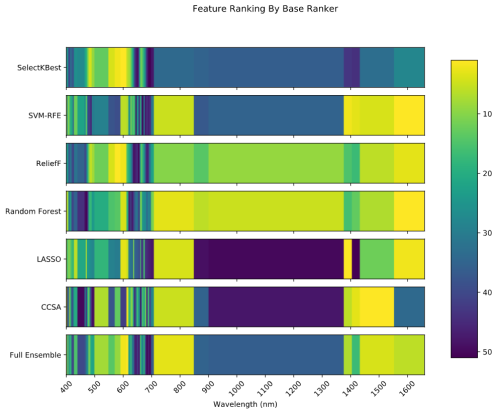
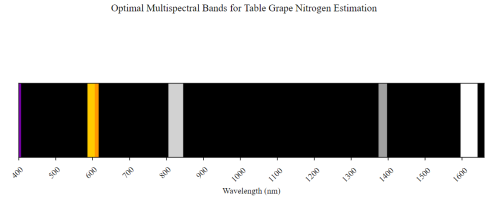
From the 1,339 original wavelengths, the pipeline selected a set of just six multispectral bands centered at 596, 611, 401, 1619, 825, and 1386 nm with bandwidths of 20, 10, 6, 46, 40, and 23 nm, respectively. Trained on these six bands, a QDA classifier was able to obtain a mean F1 score of 0.86 on a training set of extreme samples (N <= 2.55% or N >= 3.4%) and an F1 score of 0.70 on a test set of moderate samples (2.55% < N < 2.66% or 3.35% < N < 3.4%). Shortwave infrared bands accounted for two of the six selected bands, which have been shown to be the best predictors of nitrogen in bigleaf maple leaves [Yoder]. The selected yellow-orange bands centered at 596 and 611 nm lie in a blind spot between the green and red bands of commercial multispectral sensors. Likewise, the selected violet band centered at 401 nm and the selected shortwave infrared bands centered at 1619 and 1386 nm lie outside the range of commercial multispectral sensors.
The potential improvement in remote sensing of nitrogen in grapevines brought forth by a customized multispectral sensor centered at the selected bands is promising and worth further investigation.