
2018 research update
Remote sensing for precision vineyard nutrient management
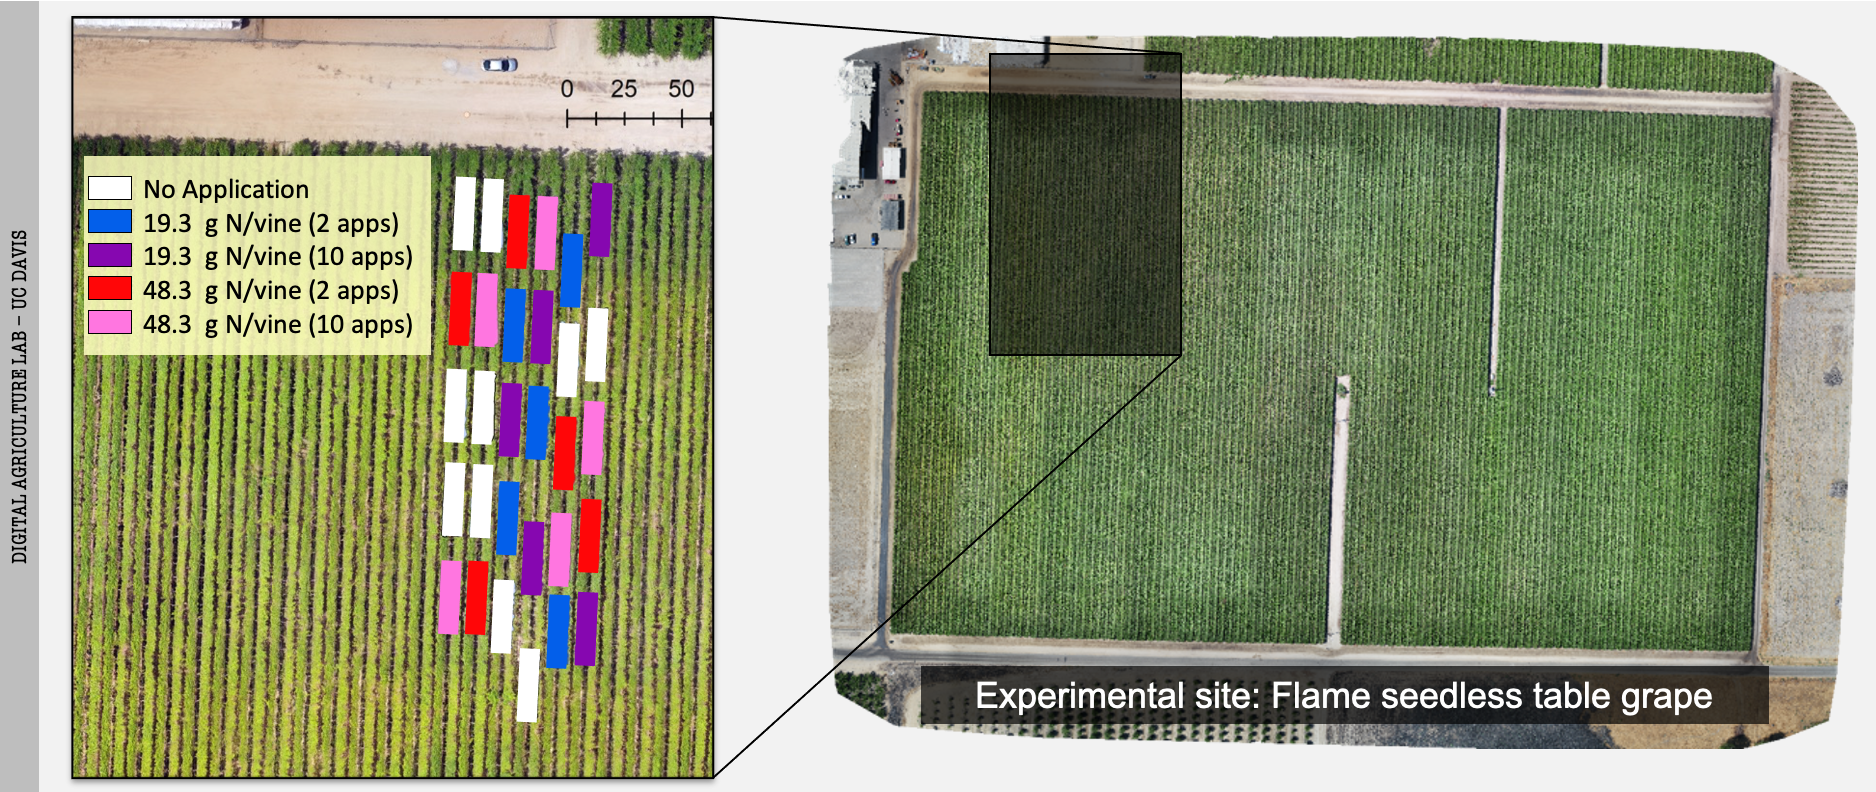
Our main objective in 2018 was to investigate aerial multispectral imaging's potential for detecting grapevine Nitrogen status. In 2018, we created an experimental plot design with three different N application rates of (0, 19.3, and 48.3 g N/vine) applied in either two (Slugs) or 10 (Spoonfeed) separate applications throughout the season and with 5 repetitions. In total, we had 30 plots; each included 5 vines.
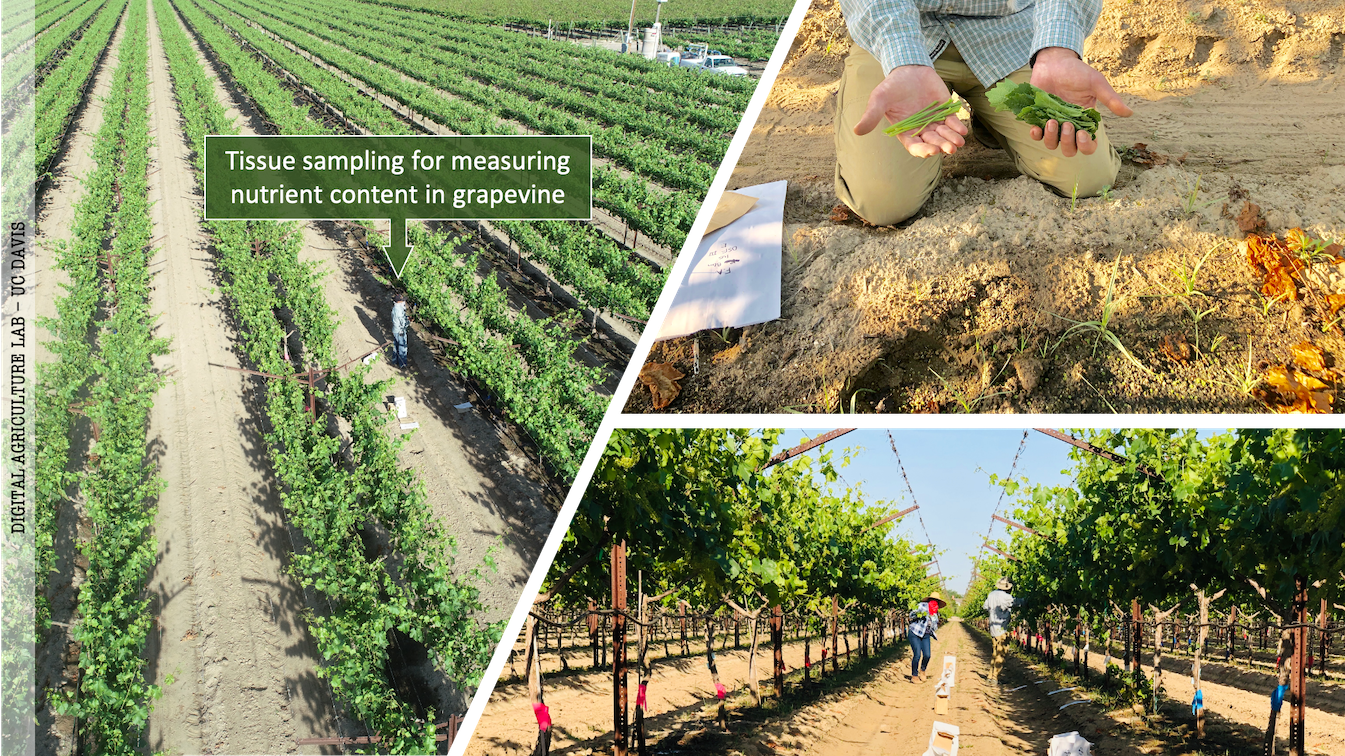
Tissue samples were collected from vines in the experimental plot and assessed in the laboratory for true nitrogen status. The nitrogen content percentage were used as labels to calibrate the multispectral data interpretation model.
We flew over a Flame Seedless vineyard in Selma, CA, once during the bloom and once before harvest. Tissue samples collected from each plot (of 5 vines) were mixed, and the lab analytics provided us with 30 nutrient labels for 30 experimental plots (1 label per 5 vines in a plot). Various potential vegetation indices (identified by other researchers for monitoring N) were extracted from aerial multispectral data and tested to check if different Nitrogen levels in the vine will lead to distinctive vegetation indices values. The following figure lists the vegetation indices tested in this study:

Correlation between leaf nitrogen and vegetation indices was calculated and plotted in the figure below. The blue columns show the R-squared value, and the orange line shows p-values for each index. The best correlation was achieved when R-squared was high and the p-value was low; this means the model significantly explains most of the variation within the data.
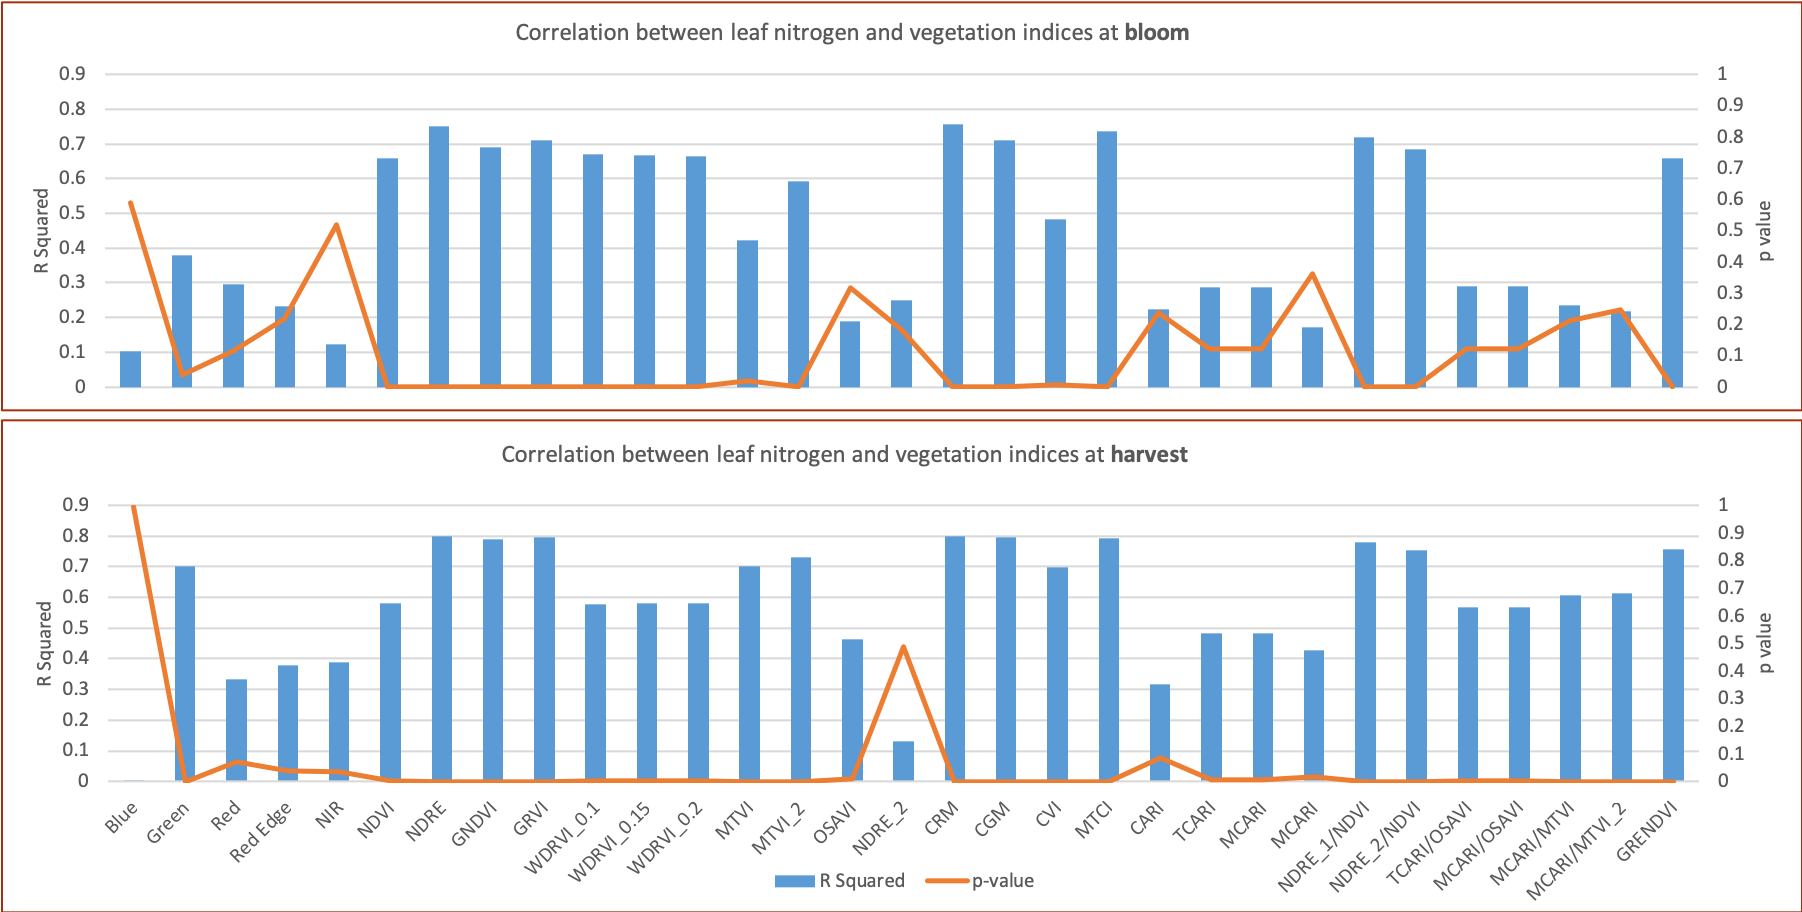
Based on the correlation results, NDRE, CGM, and MTCI showed the best correlation to vine nitrogen in table grape. This graph also showed that NDVI, i.e., the most commonly used vegetation index, was not as good as NDRE, CGM, or MTCI for detecting N content. Among the 20 indices tested in this study, NDRE was the best vegetation index at both growing stages (bloom and harvest).
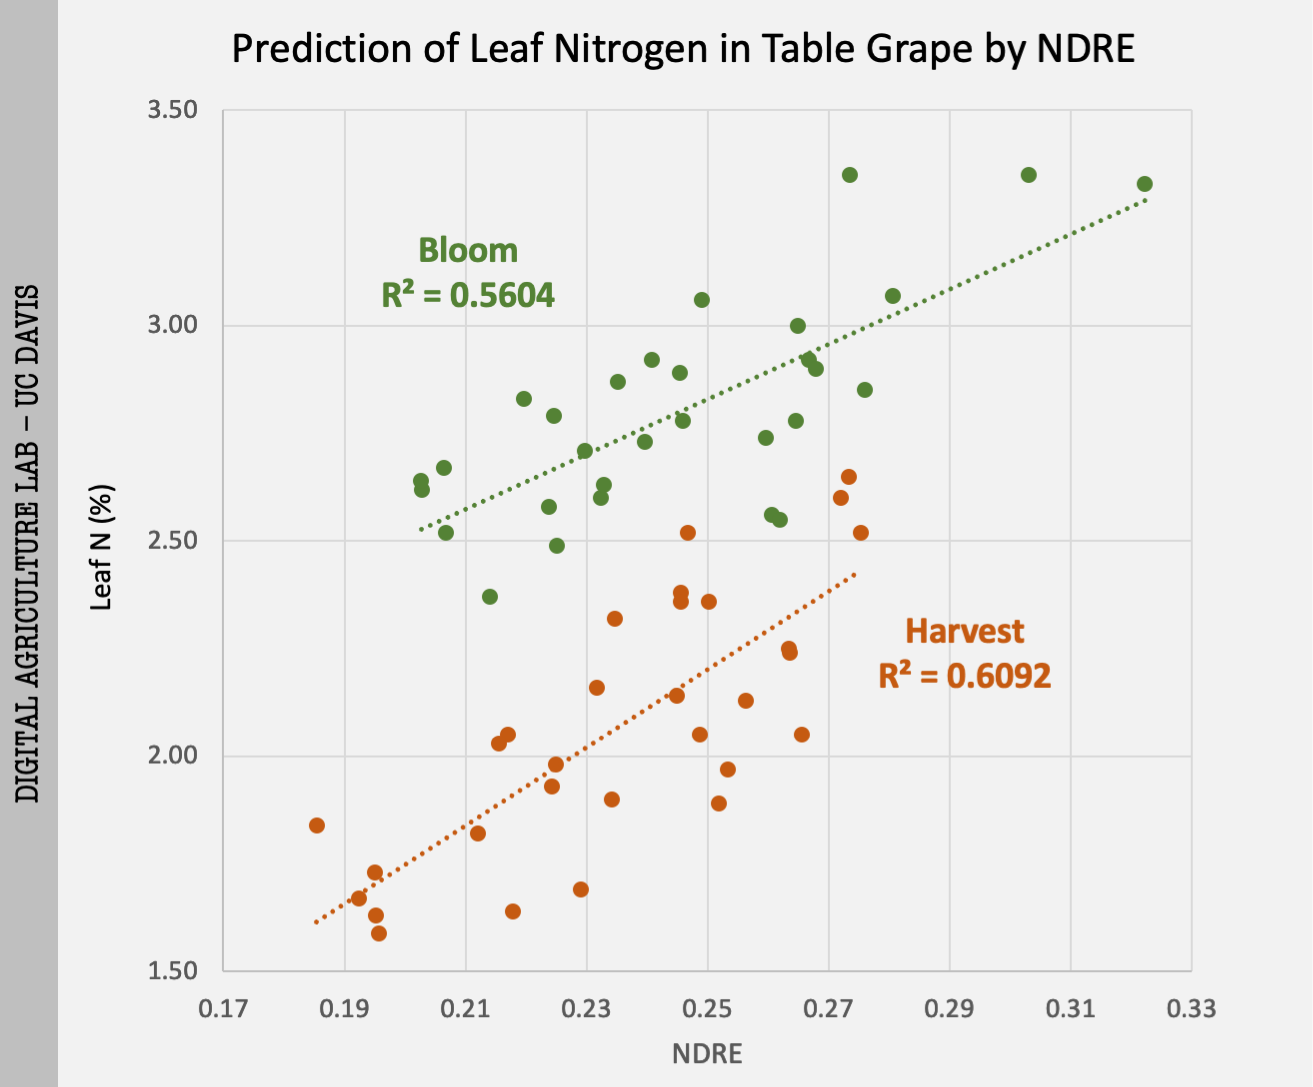
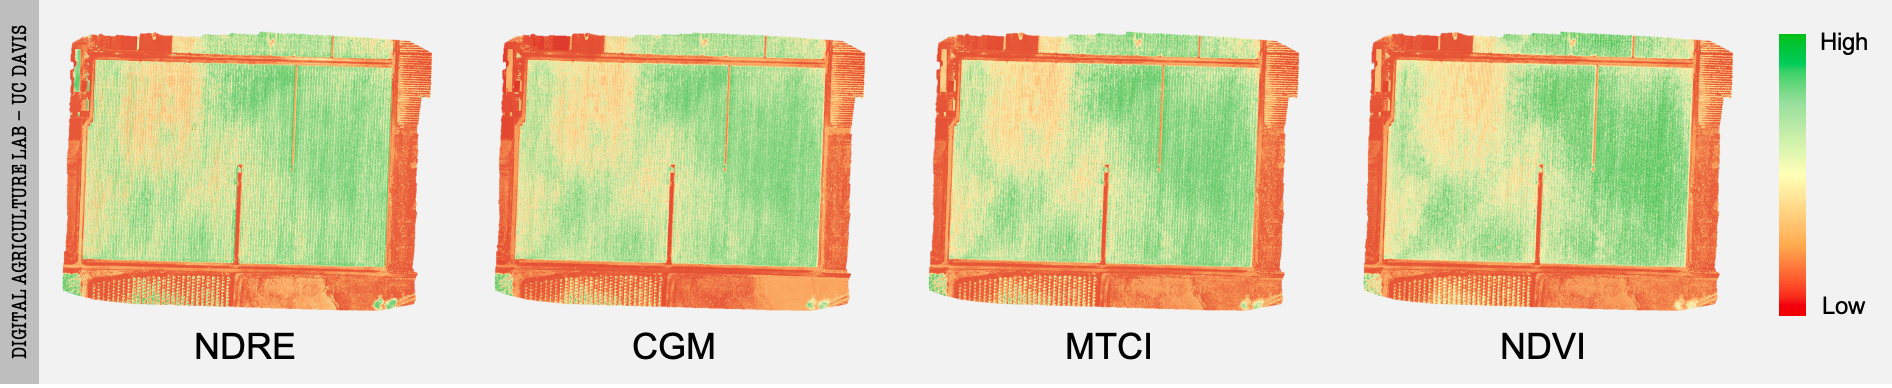
The following figure shows the top three vegetation indices and NDVI for an experimental flame seedless vineyard at harvest time. Almost all four indices indicated the Nitrogen-deficient zones, but based on the regression results, NDRE is the most reliable.
These results confirmed that vineyard managers could obtain an insight into spatial variability of nitrogen throughout the entire vineyard using drone-based multispectral imagery.